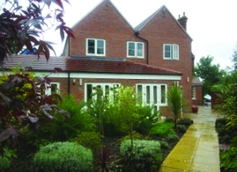
| Henwick Grange Nursing Home - Worcester | VS | All other Care Homes UK |
| Contact details | |||||
|---|---|---|---|---|---|
| Phone | (01905) 424705 | ||||
| Standard | |||||
|---|---|---|---|---|---|
| Standard 1 | Overall: Improvements Required | ||||
| Standard 2 | Overall: Meeting This Standard | ||||
| Standard 3 | Overall: Meeting This Standard | ||||
| Standard 4 | Overall: Meeting This Standard | ||||
| Standard 5 | Overall: Meeting This Standard | ||||
| # of standards being met |
4 (0.84 lower than average)
|
vs |
4.84
|
||
| # of standards need improvement |
1 (1.83 lower than average)
|
vs |
2.83
|
||
| Outcome | |||||
|---|---|---|---|---|---|
| outcome 1 | Improvements Required | ||||
| outcome 2 | Meeting This Standard | ||||
| outcome 4 | Meeting This Standard | ||||
| outcome 5 | Meeting This Standard | ||||
| outcome 6 | Meeting This Standard | ||||
| outcome 7 | Meeting This Standard | ||||
| outcome 8 | Meeting This Standard | ||||
| outcome 9 | Meeting This Standard | ||||
| outcome 10 | Meeting This Standard | ||||
| outcome 11 | Meeting This Standard | ||||
| outcome 12 | Meeting This Standard | ||||
| outcome 13 | Meeting This Standard | ||||
| outcome 14 | Meeting This Standard | ||||
| outcome 16 | Meeting This Standard | ||||
| outcome 17 | Meeting This Standard | ||||
| outcome 21 | Meeting This Standard | ||||
| # of outcomes being met |
15 (0.66 lower than average)
|
vs |
15.66
|
||
| # of outcomes need improvement |
1 (1.17 lower than average)
|
vs |
2.17
|
||
